Category Archives: Stock Analysis

Dive deep into the specifics of individual stocks. Analyze company financials, leadership, market position, and future prospects

Integrated Technologies Ltd: Navigating the Circuit of Financial Stability

Background

Integrated Technologies Ltd, incorporated in 1995, is a manufacturer of printed circuit boards (PCBs). The company utilizes state-of-the-art process technology from FUBA Printed Circuits Gmbh, Germany. As a 100% Export Oriented Unit, it has been producing high-quality single-sided, double-sided, and multilayer PCBs.

Manufacturing Capacity

The company’s production unit, located in New Delhi, boasts an installed capacity of approximately 54,000 Square Meters per annum, broken down as follows:

  • Single-Sided: ~14,000 square meters
  • Double-Sided: ~25,000 square meters
  • Multilayer: ~15,000 square meters

The Bumpy Ride

Despite its robust production capabilities, Integrated Technologies has faced some operational challenges. It remained inoperative for several years, resulting in substantial losses and complete erosion of its net worth. Despite efforts to restructure its PCB manufacturing unit since 2010, the company had to abandon the business due to asset obsolescence.

Financial Health and Performance

The company has managed to clear all its liabilities, save for some unsecured debt outstanding to promoters, which they are reinvesting in the company. This act shows a commitment to the company’s revival.

Key financial indicators include:

  • Market Capitalization: ₹ 36.7 Cr.
  • Current Stock Price: ₹ 76.8
  • Stock P/E: 27.0
  • Book Value: ₹ 1.17
  • ROCE: 168%
  • Debt to Equity Ratio: 1.77

Looking Forward

In FY22, Integrated Technologies only generated Other Income, which comprised of credit balances written back. This fact shows that the company is still in the process of financial recovery.

Despite the current challenges, it is essential to keep an eye on the company’s performance in the coming quarters. Given its history, significant installed capacity, and the reinvestment by promoters, Integrated Technologies Ltd may still hold potential for interested investors.

Quarterly Results Analysis: 

Looking at the quarterly results for the last four quarters, we observe the following:

  1. Sales: The company has shown minimal sales activity. Sales were recorded only in the quarter ending March 2022 (₹0.12 Cr) and March 2023 (₹0.04 Cr). This indicates a weak revenue generation model currently.
  2. Expenses: There has been a slight increase in expenses in the quarters ending June 2022 (₹0.05 Cr), September 2022 (₹0.04 Cr), and December 2022 (₹0.03 Cr) compared to the previous quarters. This could be attributed to the company’s efforts to revitalize its operations.
  3. Operating Profit: The company reported a positive operating profit only in the quarters ending March 2022 (₹0.01 Cr) and March 2023 (₹0.01 Cr). This demonstrates the struggling operational efficiency of the company.
  4. Net Profit: The company posted a significant net profit in the quarter ending September 2022 (₹5.06 Cr), but it was followed by losses in the next two quarters ending December 2022 (₹-0.03 Cr) and March 2023 (₹-3.62 Cr). This suggests instability in the company’s financial performance.

To generate actionable insights, the company must investigate the source of the significant net profit in the September 2022 quarter and try to replicate it. Furthermore, it needs to identify and manage the factors contributing to the losses in the subsequent quarters.

Cashflow: 

Analyzing the cash flow for the same period:

  1. Cash from Operating Activity: The company had a positive cash flow from operating activities in the quarter ending March 2023 (₹5.00 Cr), which is a good sign, indicating that the company’s core business operations are generating cash.
  2. Cash from Investing Activity: There was a negative cash flow from investing activities in March 2023 (₹-1.07 Cr), showing that the company is investing in its business, possibly for long-term growth.
  3. Cash from Financing Activity: The company showed a negative cash flow from financing activities in March 2023 (₹-3.91 Cr), suggesting it might have paid off some debt or made dividend payments.

The positive cash flow from operations is a good sign, but the company needs to ensure that this is not a one-time event and continues in the upcoming quarters. The negative cash flow from investing activities could be seen as a positive if these investments lead to increased profits in the future. However, the negative cash flow from financing activities could be a concern if it continues, as it might indicate the company is having trouble raising capital or is paying off too much debt too quickly.

Disclaimer

This article is for informational purposes only and should not be considered financial advice. Investing in the stock market involves risk, and investors should consider their risk tolerance and financial situation before making any investment decisions. While the information provided in this article is based on data available at the time of writing, the performance of any company can fluctuate over time due to a variety of factors, including market conditions, company performance, and economic factors. Therefore, past performance is not indicative of future results.

Before investing in Integrated Technologies Ltd or any other company, it’s recommended to conduct thorough research and, if necessary, consult with a qualified financial advisor. Investing involves the risk of loss, including the loss of principal. Please be aware that Integrated Technologies Ltd has been inoperative for many years, has suffered losses, and its net worth is completely eroded. These factors could significantly impact the company’s future performance and the return on your investment.
Rainbow Children’s Medicare Limited Reports Strong Growth in Q4 and FY 2023

Financial Performance Overview

Rainbow Children’s Medicare Limited has recently released its audited standalone financial results for the quarter and year ending on 31 March 2023. The report reveals the company’s robust financial health and substantial growth over the past fiscal year.

Here are the key takeaways from the financial report:

  • The company’s revenue from operations for the year ending in March 2023 was Rs. 11,139.90 million, a significant increase from the previous year’s Rs. 9,245.95 million.
  • Other income, which complements the operational revenue, also saw a rise, amounting to Rs. 312.29 million in FY 2023 as compared to Rs. 208.19 million in the previous year.
  • The total income, a combination of revenue from operations and other income, stood at Rs. 11,452.19 million for FY 2023, compared to Rs. 9,454.14 million in FY 2022.

Expenditure Analysis

On the expense side, the company reported the following:

  • The cost of medical consumables and pharmacy items consumed was Rs. 1,501.22 million in FY 2023, a decrease from Rs. 1,877.98 million in the previous year.
  • Employee benefits expenses increased from Rs. 1,094.12 million in FY 2022 to Rs. 1,360.38 million in FY 2023.
  • The company’s finance costs amounted to Rs. 520.89 million in FY 2023, a slight increase from Rs. 500.05 million in FY 2022.
  • Depreciation and amortization expenses also rose from Rs. 769.87 million in FY 2022 to Rs. 837.08 million in FY 2023.
  • The professional fees to doctors increased significantly from Rs. 1,857.80 million in FY 2022 to Rs. 2,554.04 million in FY 2023.

Profit and Earnings Per Share

After accounting for expenses, Rainbow Children’s Medicare Limited reported a profit before tax of Rs. 2,728.34 million for the year ending in March 2023, a substantial increase from the previous year’s Rs. 1,897.44 million.

The total comprehensive income for the year stood at Rs. 2,062.54 million, an increase from Rs. 1,432.65 million in the previous year.

Furthermore, the company’s earnings per share (EPS) for FY 2023 stood at Rs. 20.40 (basic) and Rs. 20.40 (diluted), a noticeable increase from Rs. 15.18 (basic) and Rs. 14.87 (diluted) in FY 2022.

Summary

The year 2023 proved to be a year of robust growth for Rainbow Children’s Medicare Limited. The company’s financial performance reflects its resilience and adaptability in the face of an evolving healthcare landscape. With its focus on providing quality healthcare, the company is well-positioned to continue its growth trajectory in the coming years.

Disclaimer: The information provided in this article is based on the financial report published by Rainbow Children’s Medicare Limited. Investors are advised to conduct their own due diligence or consult a financial advisor before making any investment decisions.

Tube Investments of India Ltd: Strategic Acquisition Enhances Market Position

Tube Investments of India Ltd (TII), a leading manufacturer catering to multiple industries, has acquired a 67% stake in Lotus Surgicals Private Limited, cementing its position in the market. With promising financials and robust growth strategies, TII is making strategic moves to diversify its portfolio and strengthen its market presence. However, the company needs to mitigate potential risks associated with high book value and possible capitalization of interest costs. This blog post takes a detailed look at TII’s recent acquisition, financial performance, and future prospects

In a strategic move to consolidate its market position, Tube Investments of India Ltd (TII), a foremost manufacturer serving major industries like Automotive, Railway, Construction, Mining, Agriculture, and more, has acquired a significant 67% stake in Lotus Surgicals Private Limited. This acquisition, executed on 10th May 2023, makes Lotus a subsidiary of TII, opening new avenues for growth and expansion.

TII has been a robust performer in the market, boasting a market cap of ₹ 53,110 Cr. and a current stock price of ₹ 2,750. The company’s main business verticals encompass Engineering, Metal Formed Products, and Bicycles. In its continuous pursuit of growth, TII has ventured into TMT bars, Truck Body Building business, and is exploring opportunities in optic lens and other vision systems for the Auto industry.

TII’s financial metrics depict a promising picture with a profit growth of 37.2% CAGR over the last five years, and a healthy dividend payout of 18.3%. The company has also been proactive in reducing its debt, further bolstering its financial stability.

However, every investment comes with its share of risks. TII’s stock is trading at 15.4 times its book value, which may be a concern for potential investors. Another point of caution is the possibility of the company capitalizing its interest cost.

A quick glance at TII’s quarterly results reveals a consistent growth trajectory. Despite a slight dip in the quarterly profit variation in Dec 2022, the company has showcased an impressive sales growth of 23.9%. The consistent EPS and robust ROCE of 29.4% further underline the company’s strong performance.

When it comes to cash flow, TII reported a net cash flow of -₹ 101 Cr. in Mar 2022. This, however, should be viewed in conjunction with the company’s strong cash from operating activity at ₹ 877 Cr.

With the recent acquisition of Lotus, TII’s potential for growth seems to be on an upward trajectory. Backed by a solid financial performance and a strategic approach towards expansion, TII is poised to make significant strides in the market. Investors and market watchers should keep a keen eye on this company as it continues to navigate its growth journey.

The following are some positive aspects of Tube Investments of India Ltd:

  1. Reduction in Debt: The company has successfully managed to decrease its debt, which could signify a more efficient use of its resources and may result in lower financial risk.
  2. Strong Profit Growth: The company has shown good profit growth of 37.2% CAGR over the last 5 years. This demonstrates a healthy upward trend in profitability, which is a positive sign for investors.
  3. Healthy Dividend Payout: The company has maintained a consistent dividend payout of 18.3%. This is a positive indication of the company’s profitability and its commitment to returning profits to shareholders.
  4. Robust ROCE and ROE: The company has demonstrated a strong Return on Capital Employed (ROCE) at 29.4% and Return on Equity (ROE) at 28.1%. These metrics indicate efficient utilization of capital and equity, respectively.
  5. Acquisition of Lotus Surgicals Private Limited: This strategic acquisition, in which TII now holds 67% of Lotus’ shares, could potentially open new revenue streams and diversify the company’s portfolio.
  6. Positive Sales Growth: Tube Investments of India Ltd has seen a sales growth of 23.9%, indicating a strong market presence and demand for its products.
  7. Diverse Product Portfolio: The company’s wide range of products caters to several major industries, which can help to mitigate risks associated with any single sector.
  8. Strategic Foray into New Industries: The company’s expansion into TMT bars, Truck Body Building business, optic lens, and vision systems for the Auto industry shows a forward-thinking approach and potential for future growth.

Despite Tube Investments of India Ltd’s (TII) impressive performance and strategic growth initiatives, there are certain aspects that potential investors should consider. Here are some potential downsides:

  1. High Stock Price to Book Value Ratio: TII’s stock is trading at 15.4 times its book value, which is significantly higher than the industry average. This could indicate that the stock is overpriced, representing a potential risk for investors.
  2. Potential Capitalization of Interest Cost: There are indications that the company may be capitalizing its interest costs. While this can enhance the appearance of profitability in the short term, it can also lead to inflated asset values and lower reported expenses. Over time, this practice could lead to financial instability and increased risk for investors.
  3. Low Dividend Yield: With a dividend yield of just 0.13%, TII may not be the best choice for income-focused investors. While the company has been maintaining a healthy dividend payout of 18.3%, the low dividend yield could be a deterrent for those seeking regular income from their investments.
  4. Negative Cash Flow: In March 2022, TII reported a negative net cash flow of ₹101 Cr. This could be a sign of potential liquidity issues and might affect the company’s ability to invest in growth opportunities, service debt, or return money to shareholders.
  5. High PEG Ratio: TII’s PEG ratio stands at 1.77, which is considered high. A PEG ratio over 1 often suggests that the stock is overvalued or that the company’s earnings growth is expected to slow.

While these factors do raise concerns, they should be evaluated in the broader context of the company’s overall performance, market conditions, and long-term growth strategies. It’s always recommended for potential investors to conduct comprehensive due diligence before making investment decisions.

Nitta Gelatin India Ltd: A Deep Dive into Its Financial Performance and Growth Prospects

In the vast landscape of the Indian manufacturing sector, Nitta Gelatin India Ltd has emerged as a powerhouse in the production and sale of ossein, gelatin, and collagen peptides. The company’s diverse product portfolio and its application across multiple sectors like pharmaceutical, agriculture, industry, and food applications, lends it a unique market positioning. In this blog post, we delve into the financial performance of the company over the past four quarters to understand its growth story and potential.

One of the key highlights of Nitta Gelatin’s recent performance is its impressive profit growth. The company has demonstrated a strong CAGR of 72.7% over the last 5 years, a testament to its robust operations and effective cost management strategies. Notably, the company’s net profit for the March 2023 quarter stood at an impressive ₹17 crore, marking a significant rise from ₹2 crore in the March 2021 quarter.

Taking a closer look at the quarterly results from June 2022 to March 2023, there’s a consistent growth trend in sales and operating profit. Sales increased from ₹134 crore in June 2022 to ₹146 crore in March 2023. Similarly, the operating profit witnessed a substantial rise from ₹21 crore to ₹27 crore during the same period. The steady growth in both these parameters underscores the company’s robust business model and its ability to navigate market volatility.

The cash flow statement further illuminates the company’s financial health. A key aspect to note here is the significant increase in cash from operating activities, a key indicator of operational efficiency. In March 2023, the company’s cash from operating activities stood at a whopping ₹101 crore, a substantial leap from ₹17 crore in June 2022.

Further, the company’s debt reduction efforts deserve a special mention. With a Debt to Equity ratio standing at a comfortable 0.15, Nitta Gelatin has effectively managed its financial obligations, paving the way for sustainable growth.

In conclusion, Nitta Gelatin India Ltd’s financial performance in the past four quarters paints a picture of a company on a solid growth trajectory. Its impressive sales growth, profit margins, and cash flow management, coupled with a strong debt reduction strategy, make it a compelling study for investors and market watchers alike. Stay tuned as we continue to monitor its financial journey and bring you the latest updates.

Max Healthcare: A Comprehensive Analysis

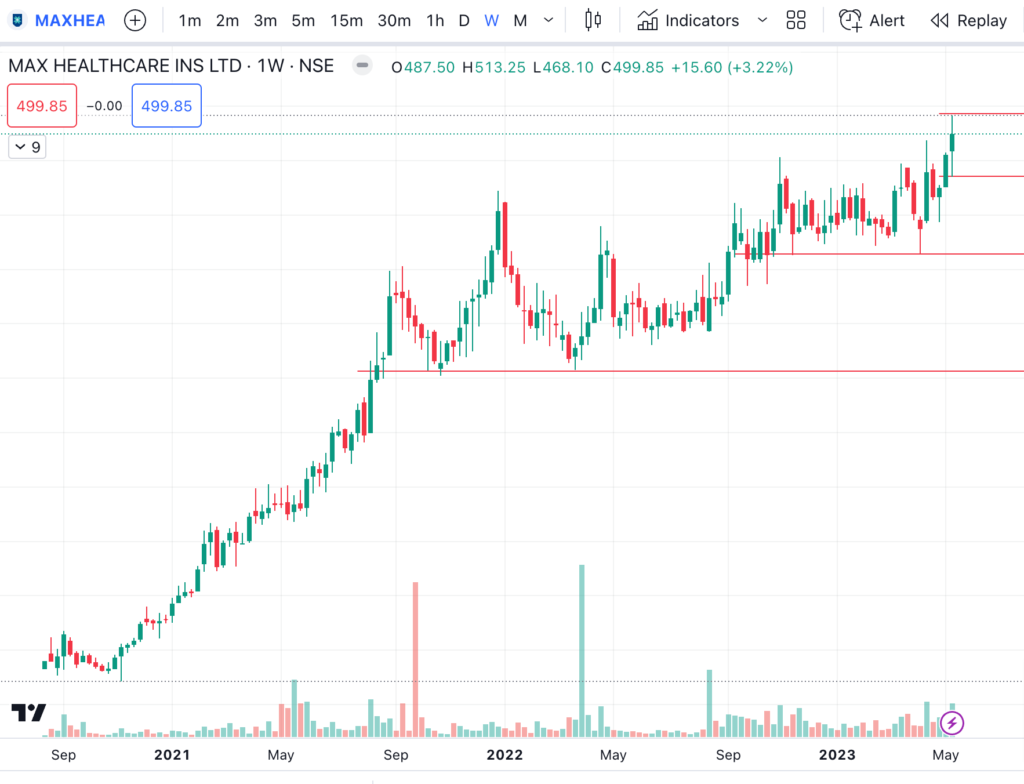
Max Healthcare has been making waves in the stock market, drawing attention from investors and traders alike. However, understanding its market trends and making informed decisions requires a thorough analysis. This article seeks to provide such an examination, focusing on the pattern Max Healthcare’s stocks have followed over time and what it might indicate for the future.

Max Healthcare’s pattern has been quite interesting, starting with a strong momentum upwards followed by a pullback. After this pullback, the stock tried to give a breakout but fell instead. It tried again to gain momentum but was not successful. For a time, the price action was flat, indicating a level where sellers waited. This pattern repeated until finally, a breakout occurred and the market moved upwards.

Interestingly, the breakout around the 400 to 420 levels was followed by a higher level somewhere around 460. The stock traded at this level for an extended period, signaling that sellers were favoring this level. However, if the stock was weak, there would be momentum. The stock went up once, then there was a price action, and if it paused at this point, it could continue the trend.

Currently, Max Healthcare has reached a higher level after a prolonged period. If the stock continues to trade between the 460 to 480 levels, a breakout could be imminent. If it does continue, this could result in a surge in momentum or even 4 to 5 green-colored candle momentum. This is because, in the past, sellers fought over the stock at the 460 levels for a long time.

On a weekly chart, the stock has shown a similar pattern. The stock came down once, then the market went up. It tried again at this level and has now gone above this. From here, it can move in continuation. The stock has shown an accumulation in the range of 360 to 440, following which there was a breakout. If the pattern continues, Max Healthcare’s stock looks promising for the future.

When planning a stop loss, it’s essential to note that for those planning on a positional basis, the stop loss should be planned around the 320 levels. If aiming for a long-term strategy, a stop loss of around 380 to 390 would be more suitable as these were the previous swing levels.

When planning for the long term, it’s crucial to remember not to hold any stock out of emotional attachment. Instead, focus on the price. If you purchase at ₹100 and sell at ₹150, then only you will have a profit. Similarly, if you short at ₹150 and buy at ₹100, then only you will have profit. The target should be how to earn the difference between the buying and selling price, irrespective of the stock.

In conclusion, while Max Healthcare’s stock pattern looks promising, it’s crucial to approach it with a strategic mindset. Be prepared for potential losses and manage your positions carefully to maximize profits. Always remember, emotional attachment to a stock may hinder your ability to make objective decisions, which is key in successful trading.

Tata Power: A Detailed Analysis of Market Movements and Predictions

In the world of stock trading, trends can provide significant insight for investors seeking to make strategic decisions. Tata Power, a major player in the Indian energy sector, presents an interesting case study in this regard. In this article, we will delve into an in-depth analysis of the company’s recent stock performance and explore potential future developments.

A Rollercoaster of Price Movements

Tata Power’s stock performance has been characterized by a series of ups and downs. After a rise, the market has shown a slow and steady decline, followed by another upswing. A particularly noteworthy aspect is the price action, which has shown significant oscillations.

The market has had instances of reaching up to 280, a price point which many believe to be incorrect, thus leading to a subsequent downward trend. This is followed by an upward trend, before the stock price fluctuates in the 200 to 210 range. In a few instances, it has even traded up to 190.

The Battle between Buyers and Sellers

An interesting aspect of Tata Power’s stock performance is the distinct preference of buyers and sellers for certain price levels. Buyers seem to favour the zone around 200 and 190, with the stock showing repeated instances of bouncing back from these levels. On the other hand, sellers seem to prefer the 280 to 270 range, with the stock usually being sold off when it reaches these levels. The 250 level is also considered a selling point.

At present, the market appears to be in a state of confusion as both buyers and sellers are unsure of the direction the market should take. While there are buyers waiting below, there are sellers lurking above. This has resulted in a unique price pattern.

A Closer Look at the Price Pattern

The price pattern shows that sellers have made attempts to lower the stock price, but the speed and quantity of sellers seem to be decreasing. Despite the sellers’ efforts, the stock price has shown resilience, with selling stages moving from 280 to 210, 250 to 220, 230 to 200, and 210 to 190.

Interestingly, the price action is flat at the moment, indicating that buyers are holding steady. Sellers have been trying to lower the price but haven’t been successful, suggesting that their strength is waning.

Predicting Future Movements

Given the current pattern, there is a good chance of seeing a breakout if the stock can overcome the seller’s resistance. The selling is slowly getting weaker, and if the stock can sustain its momentum between 207 and 208, then a target of 230 to 240 can be set. A stop loss of the same candle, 10 rupees, would be ideal in this case.

It’s important to remember that this prediction could take anywhere from 2 to 5 weeks to materialise, but if it does, the stock could reach a good level. This is a bullish pattern, indicating potential for buying between 208 to 210, with a stop loss around ₹10.

A Word of Caution

While this analysis presents promising prospects for Tata Power’s stock, traders should approach the market with caution. Position sizing is crucial in trading, regardless of whether you’re dealing with intraday, options, or positional trading. Also, emotional attachment to a stock can lead to significant losses. Therefore, traders should focus on the price difference between buying and selling, not the company’s name or reputation.

In conclusion, Tata Power’s stock presents a dynamic landscape that reflects the constant tussle between buyers and sellers. By closely monitoring these trends and making strategic decisions, investors can navigate this challenging market terrain and potentially reap significant rewards.

Linc Ltd: An Unseen Champion Outperforming Market Expectations

Introduction

Meet Linc Ltd – a beacon of growth in the stock market. Intriguingly, this ‘unsung hero’ of the stationery industry demonstrates that ‘boring’ businesses can, in fact, yield exciting returns.

Recent Performance

Recently, Linc Ltd has been performing exceptionally well. Over the past month alone, it has surged by an impressive 11.11% on the National Stock Exchange (NSE). Consequently, with a current price of Rs. 666.00, this stock has shown considerable promise.

Long-term Growth

However, Linc Ltd is not just a short-term player. Impressively, over the last three months, the stock has risen by a substantial 35%. This consistent increase clearly shows its resilience and growth potential.

Valuation Metrics

When it comes to valuation metrics, the company’s Price to Earnings (PE) ratio stands notably at 26. Interestingly, this is lower than the industry average PE of 45-47. This fact suggests that the stock may be undervalued, presenting an opportunity for investors.

Rewarding Shareholders

Furthermore, Linc Ltd has maintained a healthy dividend yield of 0.27%. This commitment clearly demonstrates its intent to reward shareholders, signifying a well-managed company.

Institutional Investors

Institutional investors, too, are taking notice of Linc Ltd. Over the last quarter, Foreign Institutional Investors (FII)/Foreign Portfolio Investors (FPI) holdings have seen a slight increase of 0.25%. This shift indicates growing global interest in the company.

Promoter and Mutual Fund Holding

On the one hand, promoters hold a strong 59% of the company, clearly showing their faith in its growth. On the other hand, there are currently no mutual fund holdings. This absence could, in fact, be an opportunity for diversification.

Market Capitalization

As of today, the company’s market capitalization stands robustly around Rs. 1000 crores. This ‘quiet giant’ has achieved substantial growth over the years.

Conclusion

In summary, Linc Ltd is a compelling story of consistent performance and steady growth. For investors looking for solid fundamentals and prudent financial management, this company offers a compelling case. It’s a shining example that sometimes, the most rewarding investments are those that remain steadfastly committed to their craft.

Beyond the Hype: Linc Pen’s Stellar Stock Performance

Linc Ltd, a steadfast stalwart in the world of stationery, has built a reputation for crafting reliable and efficient writing instruments. At the core of its operations is the production and distribution of pens and refills. But it’s more than just a pen company; Linc Ltd is a testament to the longevity and resilience of the humble pen in an increasingly digital age.

Despite not being enveloped in the glitz and glamor often associated with the more frequently discussed stocks, this company has etched a niche for itself through its unwavering focus on quality and customer satisfaction. In an era where ‘boring’ businesses often fall by the wayside, Linc Ltd’s commitment to the fundamentals of its industry has allowed it to not only survive, but thrive.

The story of Linc Ltd is one of quiet success and sustainable growth, proving that sometimes, the most exciting stories are not told with fancy words and extravagant phrases, but with steadfast dedication to one’s craft. This is the story of how a seemingly ordinary writing instrument manufacturer carved its path to extraordinary financial success.

Sustained Profit Growth: A Five-Year Success Story

Linc Ltd’s financial health presents an impressive tale of robust management and prudent fiscal strategy. The company has made significant strides in reducing its debt burden, and now proudly operates as an almost debt-free entity. This strategic move has allowed Linc Ltd to focus its resources on growth and expansion rather than servicing loans, thereby strengthening its market position.

The forecast for the upcoming quarter is optimistic, reflecting the company’s consistently strong performance and growth trajectory. A testament to this is the impressive profit growth that Linc Ltd has delivered over the past five years, registering a Compound Annual Growth Rate (CAGR) of 39.0%. This indicates a sustained pattern of profitability, indicative of effective operations and strategic planning.

Moreover, Linc Ltd has been maintaining a healthy dividend payout of 17.6%, demonstrating its commitment to rewarding shareholders and its confidence in its financial standing. This balance of reinvesting profits for growth and providing returns to shareholders is a sign of a well-managed company.

Additionally, the company has shown significant improvement in its debtor days, reducing from 38.4 to 29.0 days. This efficiency in accounts receivable management translates to faster collection times, improving cash flow, and providing the company with more working capital for operations and investments.

Linc Ltd’s working capital requirements have also seen a commendable reduction from 70.2 days to 55.0 days. This efficient working capital management reflects the company’s ability to meet short-term obligations and fund day-to-day operations, further solidifying its financial stability.

In summary, Linc Ltd’s financial health is robust, demonstrating the fruits of disciplined fiscal strategy, effective operations, and a commitment to sustainable growth. The ‘boring’ business of making pens and refills, as it turns out, has been anything but ordinary in its financial journey.

Operating Profit Margin: Efficiency on the Rise

let’s take a closer look at the last four quarters: March 2022, June 2022, September 2022, and December 2022.

  1. Sales Growth: The sales have seen a continuous upward trend over these four quarters. It increased from Rs. 111 crores in March 2022 to Rs. 137 crores in March 2023. This steady growth signifies an increase in demand for the company’s products and a successful sales strategy.
  2. Expense Management: The expenses have also grown, but at a slower pace compared to the sales. Expenses went up from Rs. 105 crores in March 2022 to Rs. 118 crores in March 2023. It seems that the company is successfully managing its costs while expanding its operations.
  3. Operating Profit: The operating profit has also increased significantly over the past year. It grew from Rs. 6 crores in March 2022 to Rs. 20 crores in March 2023, indicating an improved operational efficiency.
  4. Operating Profit Margin (OPM %): The OPM also shows a positive trend. Starting from 5% in March 2022, it increased to 14% in March 2023. This increase suggests that the company is becoming more efficient at converting sales into actual profit.
  5. Net Profit: The net profit shows a promising increase. It rose from Rs. 3 crores in March 2022 to Rs. 12 crores in March 2023. This reflects the company’s strong financial performance and its ability to maintain profitability.
  6. Earnings Per Share (EPS): The EPS also showed substantial growth, rising from Rs. 2.01 in March 2022 to Rs. 8.29 in March 2023. This suggests that the company’s profitability on a per-share basis has significantly improved, which is an encouraging sign for shareholders.

In conclusion, the data for the last four quarters shows that Linc Ltd has been successful in increasing its sales, managing its expenses, and improving its operational efficiency, leading to increased net profits and EPS. This underlines the company’s strong financial performance and promising outlook.