Max Healthcare has been making waves in the stock market, drawing attention from investors and traders alike. However, understanding its market trends and making informed decisions requires a thorough analysis. This article seeks to provide such an examination, focusing on the pattern Max Healthcare’s stocks have followed over time and what it might indicate for the future.
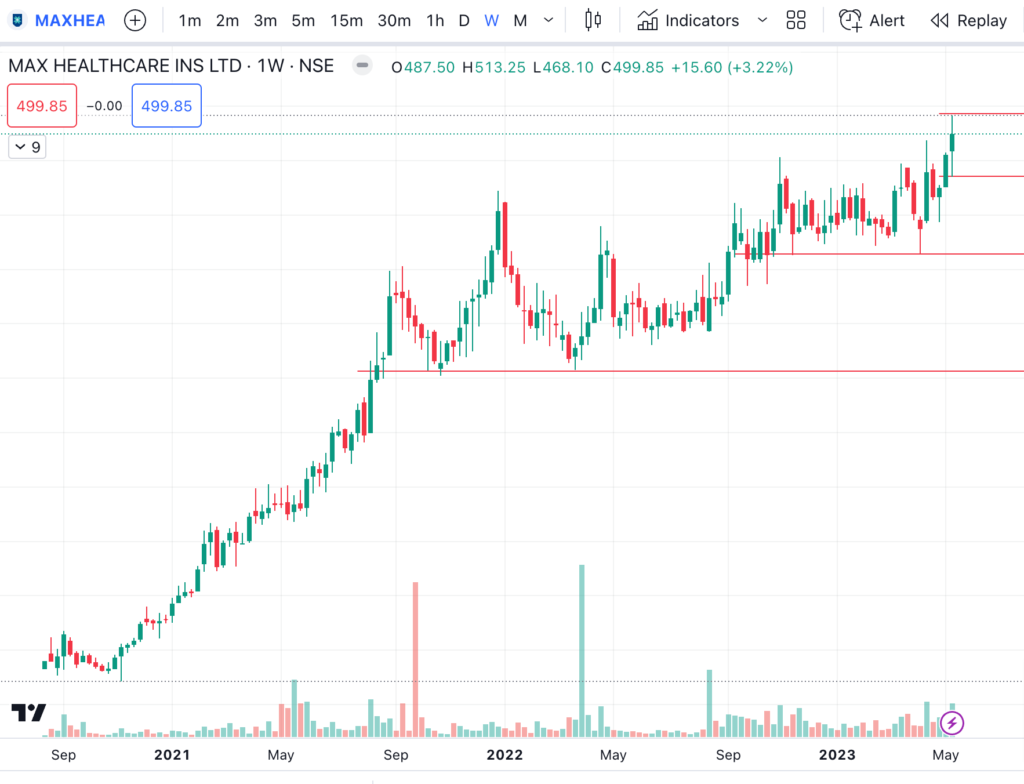
Max Healthcare’s pattern has been quite interesting, starting with a strong momentum upwards followed by a pullback. After this pullback, the stock tried to give a breakout but fell instead. It tried again to gain momentum but was not successful. For a time, the price action was flat, indicating a level where sellers waited. This pattern repeated until finally, a breakout occurred and the market moved upwards.
Interestingly, the breakout around the 400 to 420 levels was followed by a higher level somewhere around 460. The stock traded at this level for an extended period, signaling that sellers were favoring this level. However, if the stock was weak, there would be momentum. The stock went up once, then there was a price action, and if it paused at this point, it could continue the trend.
Currently, Max Healthcare has reached a higher level after a prolonged period. If the stock continues to trade between the 460 to 480 levels, a breakout could be imminent. If it does continue, this could result in a surge in momentum or even 4 to 5 green-colored candle momentum. This is because, in the past, sellers fought over the stock at the 460 levels for a long time.
On a weekly chart, the stock has shown a similar pattern. The stock came down once, then the market went up. It tried again at this level and has now gone above this. From here, it can move in continuation. The stock has shown an accumulation in the range of 360 to 440, following which there was a breakout. If the pattern continues, Max Healthcare’s stock looks promising for the future.
When planning a stop loss, it’s essential to note that for those planning on a positional basis, the stop loss should be planned around the 320 levels. If aiming for a long-term strategy, a stop loss of around 380 to 390 would be more suitable as these were the previous swing levels.
When planning for the long term, it’s crucial to remember not to hold any stock out of emotional attachment. Instead, focus on the price. If you purchase at ₹100 and sell at ₹150, then only you will have a profit. Similarly, if you short at ₹150 and buy at ₹100, then only you will have profit. The target should be how to earn the difference between the buying and selling price, irrespective of the stock.
In conclusion, while Max Healthcare’s stock pattern looks promising, it’s crucial to approach it with a strategic mindset. Be prepared for potential losses and manage your positions carefully to maximize profits. Always remember, emotional attachment to a stock may hinder your ability to make objective decisions, which is key in successful trading.


