In the world of stock trading, trends can provide significant insight for investors seeking to make strategic decisions. Tata Power, a major player in the Indian energy sector, presents an interesting case study in this regard. In this article, we will delve into an in-depth analysis of the company’s recent stock performance and explore potential future developments.

A Rollercoaster of Price Movements
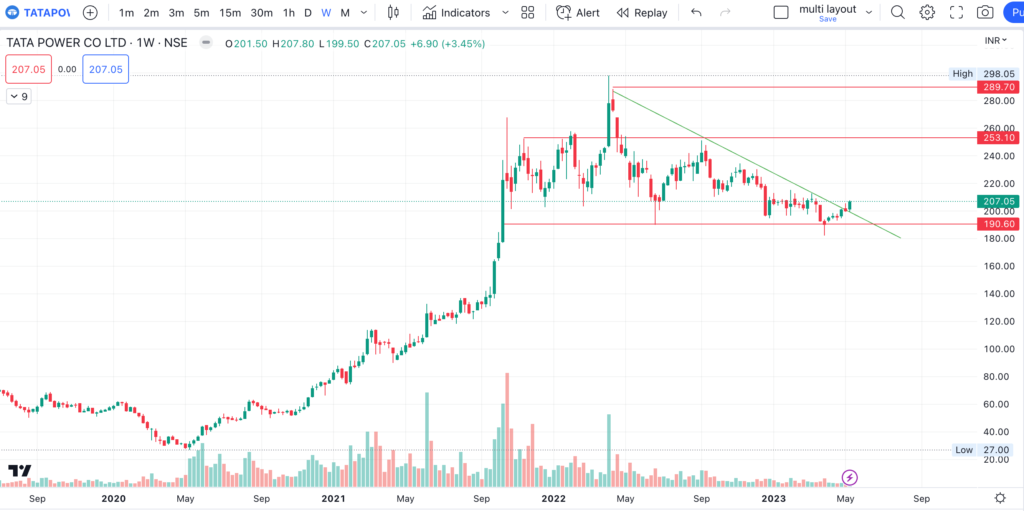
Tata Power’s stock performance has been characterized by a series of ups and downs. After a rise, the market has shown a slow and steady decline, followed by another upswing. A particularly noteworthy aspect is the price action, which has shown significant oscillations.
The market has had instances of reaching up to 280, a price point which many believe to be incorrect, thus leading to a subsequent downward trend. This is followed by an upward trend, before the stock price fluctuates in the 200 to 210 range. In a few instances, it has even traded up to 190.
The Battle between Buyers and Sellers
An interesting aspect of Tata Power’s stock performance is the distinct preference of buyers and sellers for certain price levels. Buyers seem to favour the zone around 200 and 190, with the stock showing repeated instances of bouncing back from these levels. On the other hand, sellers seem to prefer the 280 to 270 range, with the stock usually being sold off when it reaches these levels. The 250 level is also considered a selling point.
At present, the market appears to be in a state of confusion as both buyers and sellers are unsure of the direction the market should take. While there are buyers waiting below, there are sellers lurking above. This has resulted in a unique price pattern.
A Closer Look at the Price Pattern
The price pattern shows that sellers have made attempts to lower the stock price, but the speed and quantity of sellers seem to be decreasing. Despite the sellers’ efforts, the stock price has shown resilience, with selling stages moving from 280 to 210, 250 to 220, 230 to 200, and 210 to 190.
Interestingly, the price action is flat at the moment, indicating that buyers are holding steady. Sellers have been trying to lower the price but haven’t been successful, suggesting that their strength is waning.
Predicting Future Movements
Given the current pattern, there is a good chance of seeing a breakout if the stock can overcome the seller’s resistance. The selling is slowly getting weaker, and if the stock can sustain its momentum between 207 and 208, then a target of 230 to 240 can be set. A stop loss of the same candle, 10 rupees, would be ideal in this case.
It’s important to remember that this prediction could take anywhere from 2 to 5 weeks to materialise, but if it does, the stock could reach a good level. This is a bullish pattern, indicating potential for buying between 208 to 210, with a stop loss around ₹10.
A Word of Caution
While this analysis presents promising prospects for Tata Power’s stock, traders should approach the market with caution. Position sizing is crucial in trading, regardless of whether you’re dealing with intraday, options, or positional trading. Also, emotional attachment to a stock can lead to significant losses. Therefore, traders should focus on the price difference between buying and selling, not the company’s name or reputation.
In conclusion, Tata Power’s stock presents a dynamic landscape that reflects the constant tussle between buyers and sellers. By closely monitoring these trends and making strategic decisions, investors can navigate this challenging market terrain and potentially reap significant rewards.


